AOSN-II Objective Analyses
| Spatial Decay (km) |
Spatial Zero Crossing (km) |
Temporal Decay (day) |
| Synoptic | 15 | 37.5 | 10 |
| Mean | 45 | 112.5 | 1000 |
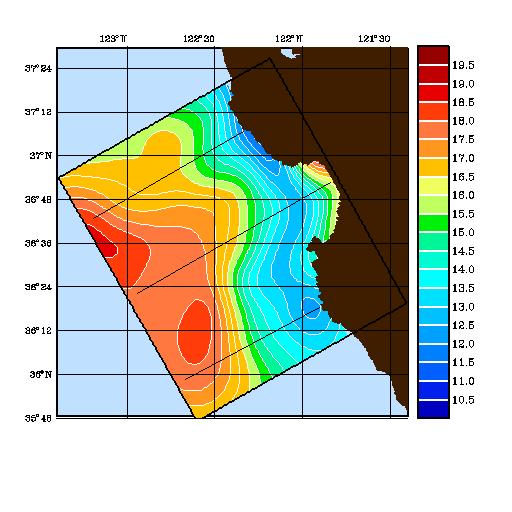
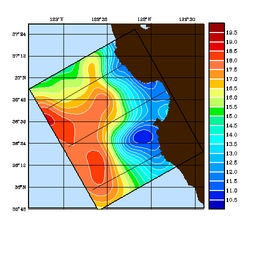
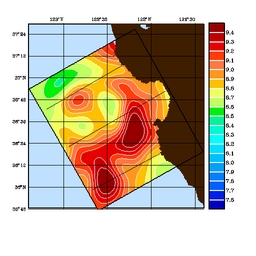
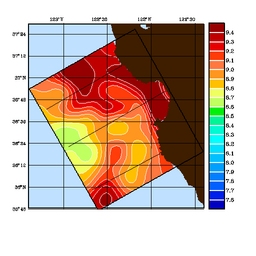
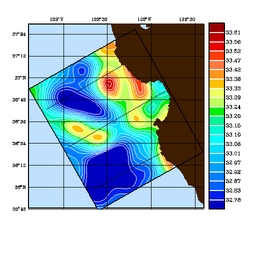
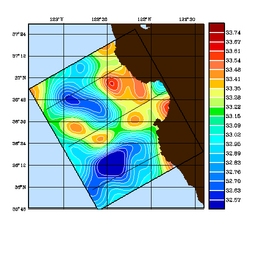
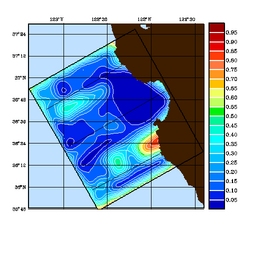
The fields below were produced by the HOPS Objective Analysis of the
AOSN-II data. The OA utilizes the Gauss-Markov or minimum error variance
criterion to map the available data
to horizontal grids (Carter and Robinson, 1987; Robinson, 1996).
For each field below, all data acquired in within a 72 hour time span surrounding
the central dates of 5 August, 15 August and 23 August (i.e. 36 hours before and
after 217.0 for 5 August)
were blended in a two-scale analysis. This data consists of: Pt.
Sur CTD, John Martin CTD, WHOI Gliders, SIO Gliders and NPS aircraft SST.
The scales used in the analytic correlation appear in the table at right.
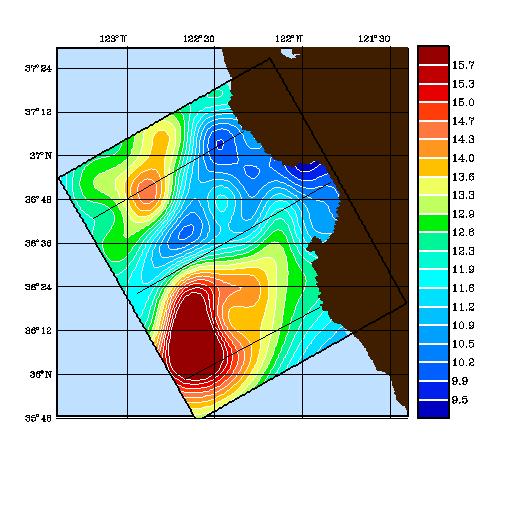
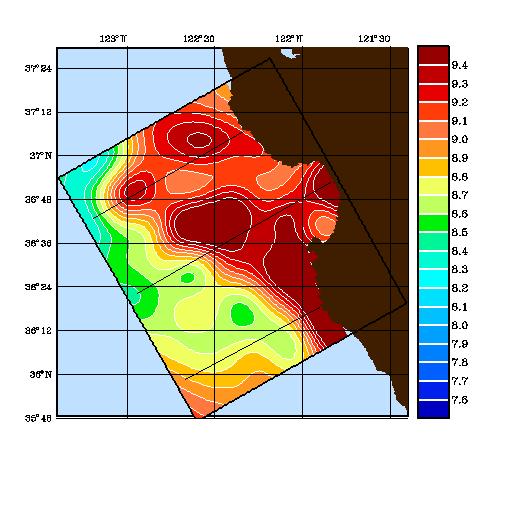
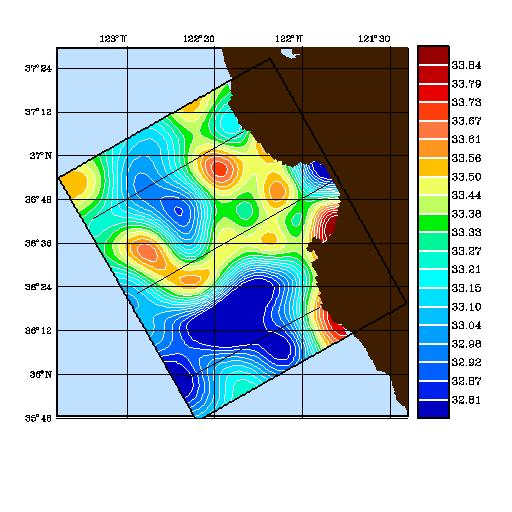
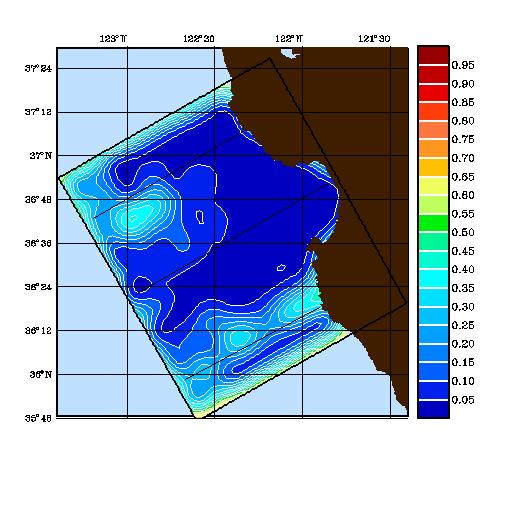
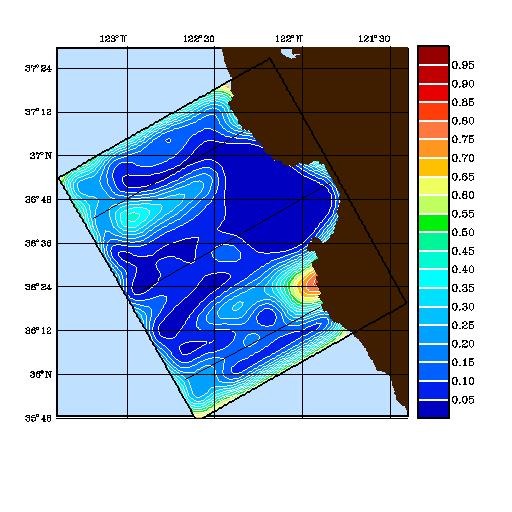
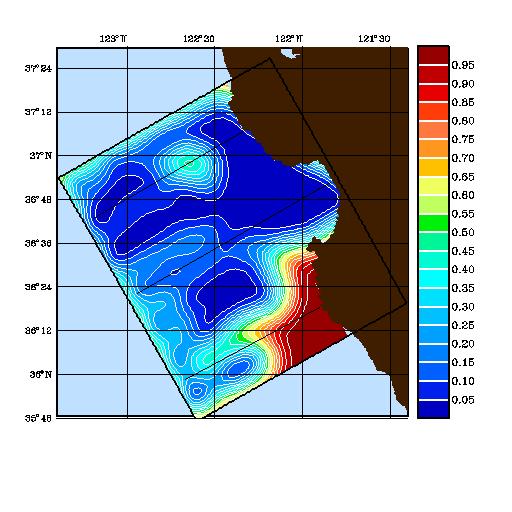
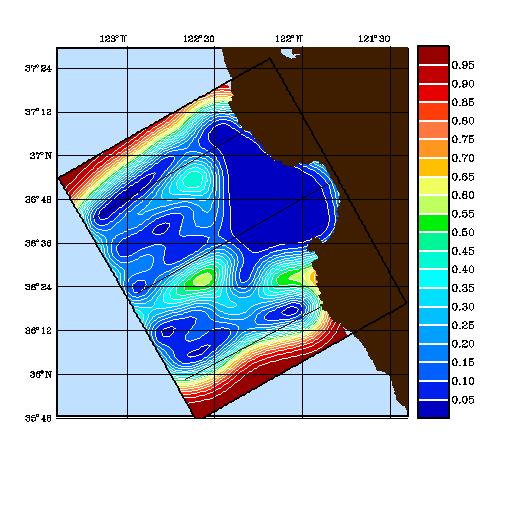
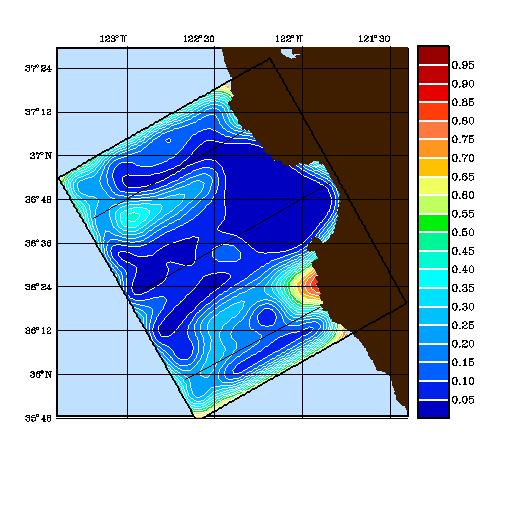
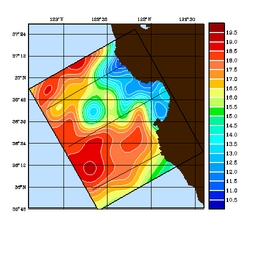
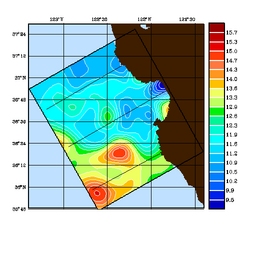
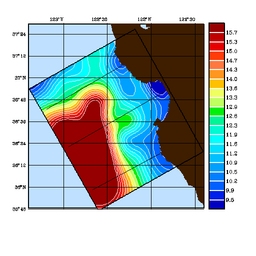
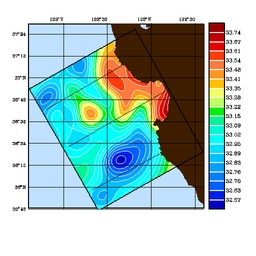
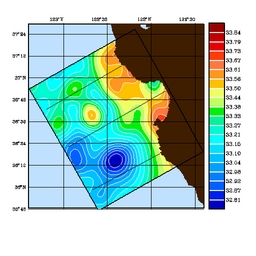
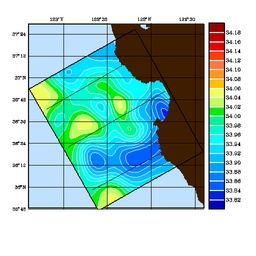
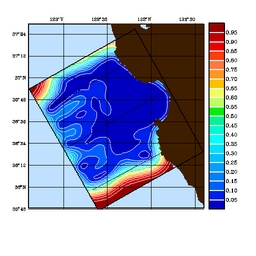
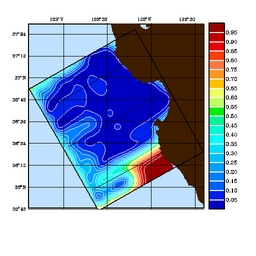
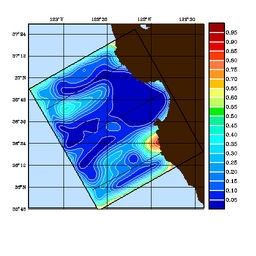
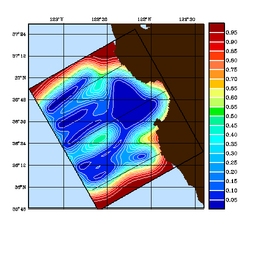
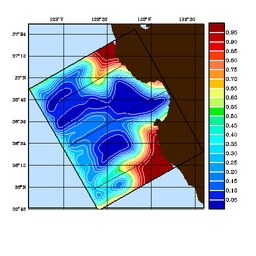
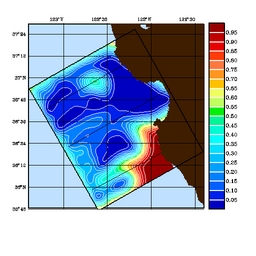
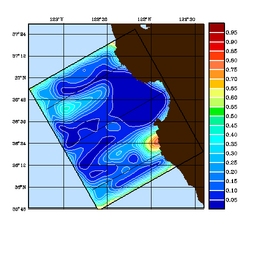
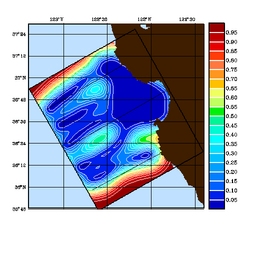
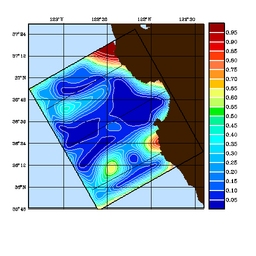
When viewing each field (Temperature, Salinity) one should simultaneously
examine the corresponding error field. Where the error field is lower, the
field is nearer to an observation and hence more representative of the
actual ocean state. Further from these low error regions, the mapped
field is an OA extension.
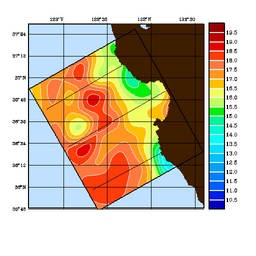
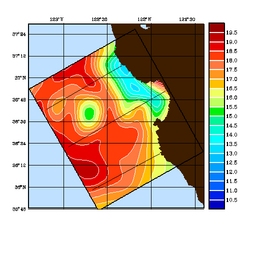
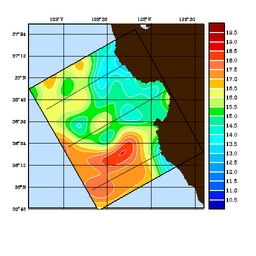
Temperature
| 5 August | 15 August | 23 August |
| 5 Meters |
|

|
|
| 10 Meters |
|
|
|
| 30 Meters |
|
|

|
| 150 Meters |

|
|
|
Salinity
| 5 August | 15 August | 23 August |
| 5 Meters |
|

|

|
| 10 Meters |
|

|
|
| 30 Meters |

|

|
|
| 150 Meters |

|

|
|
Temperature Error
| 5 August | 15 August | 23 August |
| 5 Meters |

|
|
|
| 10 Meters |

|

|

|
| 30 Meters |
|

|

|
| 150 Meters |

|
|
|
Salinity Error
| 5 August | 15 August | 23 August |
| 5 Meters |
|

|
|
| 10 Meters |
|
|

|
| 30 Meters |

|

|

|
| 150 Meters |
|

|

|